Contrary to what Edwin Starr claims, WAR is actually good for a whole lot of things. To his credit, he was about 40 years early for the statistic to gain attention, so he may have been talking about something else. Joking aside, WAR is discussed today as commonly as batting averages. Casual baseball fans can explain what batting average means and how to calculate it, but what the hell is WAR? Better yet, how do you calculate it?
The Basics
Per FanGraphs, “Wins Above Replacement (WAR) is an attempt by the sabermetric baseball community to summarize a player’s total contributions to their team in one statistic. You should always use more than one metric at a time when evaluating players, but WAR is all-inclusive and provides a useful reference point for comparing players. It is a comprehensive statistic that estimates the number of wins a player has been worth to his team compared to a freely available player such as a minor league free agent.”
Essentially, WAR helps answer the question, “If this player got injured and their team had to replace them with a freely available minor leaguer or a player from their bench, how much value would the team be losing?” This statistic is calculated so that we can, for example, say Player X is worth +6.3 wins to their team while Player Y is only worth +3.5 wins. This means it is highly likely that Player X is more valuable than Player Y.
While WAR is not as complicated as it may seem, it does require a lot of information to calculate and understand. However, instead of diving into these scary looking formulas…
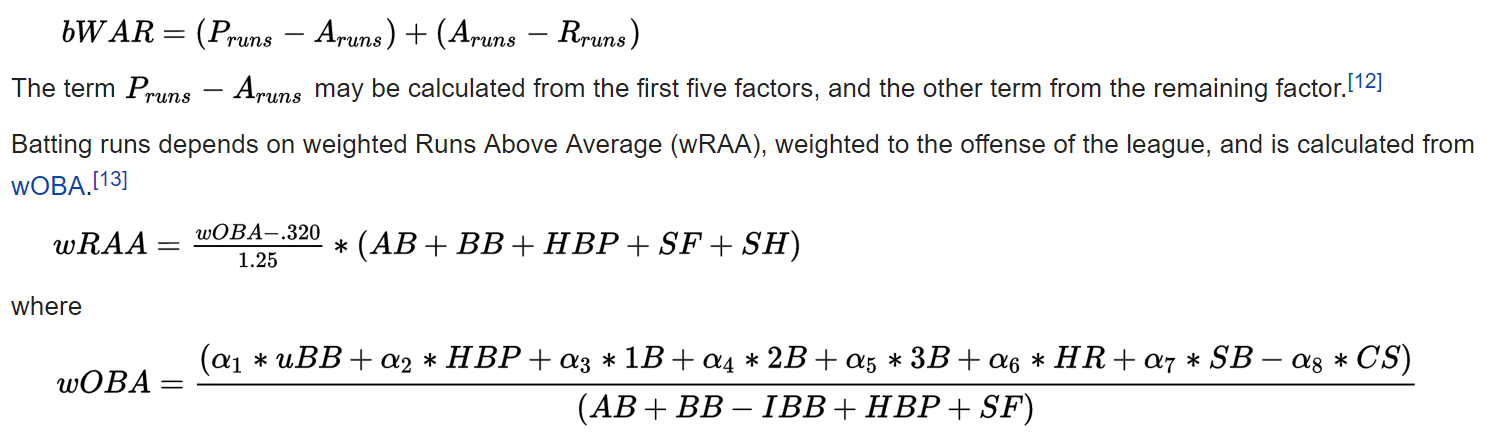
…I am just going to focus on its significance and how to properly use it.
Background
Despite its now mainstream use in sports media, WAR is not recognized as an official stat by Major League Baseball or by the Elias Sports Bureau. There are a couple main reasons for this. First, there is not an established formula for WAR as sources that provide the statistic calculate it differently. The main three of these being Baseball Prospectus, Baseball-Reference, and FanGraphs. Secondly, all three use imperfect statistics, such as advanced fielding metrics that are subjectively tracked by hand. And finally, WAR is meant to be an estimation, not a specific measure. However, all three sources publish the method they use to calculate WAR, and all use similar basic principles to do so.
If you read my explanation about my model, you know that I use FanGraphs statistics and projections to create my own daily predictions. I personally think they are the best in the business, but Baseball-Reference does great work as well. When you see WAR on ESPN, that’s Baseball-Reference’s calculation – so they must be doing something right. However, many sports bettors that use analytics like myself would agree that Baseball Prospectus (and specifically their PECOTA projections) are at the bottom of the sabermetrics totem pole. Just don’t use it.
In March 2013, FanGraphs and Baseball-Reference agreed to standardize the talent level of a replacement-level player; which is the base level for WAR values. As mentioned above, a replacement level player is a freely available minor leaguer or a bench player in the majors. They had a small difference between their calculations prior to this, but now they both assume a team of only replacement-level players are expected to win 29.4% of the time, or 48 games out of a 162 game season. However, they still use different methods for estimating offensive, defensive, and pitching value, so their results differ in some cases.
How Can I Use WAR?
As I explained above, WAR is meant to represent how valuable a player is in terms of wins. For example, Bryce Harper is currently projected to finish the season with 6.6 Wins Above Replacement (per FanGraphs). This means that if Harper had been injured and missed the whole season, and was replaced by a 0.0 WAR replacement-level player (such as Ryan Raburn), the Nationals should expect to win 6-7 less games. It is important to remember, though, that WAR is an estimation and not a precise measurement.
Had the Nationals somehow traded for Red Sox right-fielder Mookie Betts in this theoretical situation, who has a projected 5.8 WAR for this season, we should expect very little if any drop-off in the team’s performance. Despite the 0.8 WAR difference between Betts and Harper, you couldn’t accurately say that the Nationals will win one less game. Instead, WAR is best used for grouping players:
| Level | Player Example (2017 WAR) | |
|---|---|---|
| Replacement | 0 WAR | Hunter Renfroe (0.0) |
| Scrub | 0-1 WAR | Alex Gordon (0.9) |
| Role Player | 1-2 WAR | Kolten Wong (1.6) |
| Solid Player | 2-3 WAR | Yasiel Puig (2.5) |
| Good Player | 3-4 WAR | Charlie Blackmon (3.6) |
| All-Star | 4-5 WAR | Aaron Judge (4.7) |
| Superstar | 5-6 WAR | Kris Bryant (5.9) |
| MVP | 6+ WAR | Bryce Harper (6.6) |
Based on this chart, Harper is a MVP-caliber player and Betts is right on the border – I don’t think anyone could argue that. One could fairly say that Harper is slightly better overall than Mookie Betts at this point in time, but due to WAR’s estimated nature, using the 0.8 difference should not be part of that debate. Instead, WAR can be used to distinguish players as above. For example, Harper’s teammate Daniel Murphy has a projected 4.0 WAR for the 2017 season. Murphy is certainly a valuable player and can be considered an All-Star, but Harper is clearly better. This is where you can appropriately use WAR.
Why Should I Use WAR?
Amazingly, a similar example comes from a recent (and controversial) MVP race. Many baseball fans can recall the huge debate that occurred in 2012 between traditionalists and sabermetric followers for who should win the American League MVP award. Tigers third baseman Miguel Cabrera became the first Triple Crown winner in 45 years, but Angels rookie phenom Mike Trout lit up sabermetric leaderboards and won AL Rookie of the Year. There was already tension between the old and new schools of thinking in the baseball world, and this argument intensified it greatly.
As someone who is a complete nerd with both analytics and baseball history, it was tough for me to take a side five years ago. The Triple Crown is still an incredible accomplishment, but we have so many incredible statistics now that can accurately measure true performance and a player’s contribution to their team – in other words, their value. Here is how the two performed in both traditional stats…
| Name | Team | G | AVG | HR | RBI | R | SB | OBP | SLG |
|---|---|---|---|---|---|---|---|---|---|
| Miguel Cabrera | Tigers | 161 | .330 | 44 | 139 | 109 | 4 | .393 | .606 |
| Mike Trout | Angels | 139 | .326 | 30 | 83 | 129 | 49 | .399 | .564 |
…and sabermetrics:
| Name | Team | BABIP | ISO | wOBA | wRC+ | BsR | Off | Def | WAR |
|---|---|---|---|---|---|---|---|---|---|
| Miguel Cabrera | Tigers | .331 | .277 | .417 | 166 | -7.3 | 46.4 | -8.2 | 6.4 |
| Mike Trout | Angels | .383 | .238 | .409 | 167 | 14.1 | 64.2 | 13.0 | 10.3 |
BABIP (Batting Average on Balls in Play): The rate at which the batter gets a hit when he puts the ball in play, calculated as (H-HR)/(AB-K-HR+SF).
ISO (Isolated Power): Average number of extra bases per at bat, calculated several ways such as SLG minus AVG.
wOBA (Weighted On Base Average): Combines all the different aspects of hitting into one metric, weighting each of them in proportion to their actual run value. While batting average, on-base percentage, and slugging percentage fall short in accuracy and scope, wOBA measures and captures offensive value more accurately and comprehensively.
wRC+ (Weighted Runs Created Plus): The most comprehensive rate statistic used to measure hitting performance because it takes into account the varying weights of each offensive action (like wOBA) and then adjusts them for the park and league context in which they took place.
BsR (Base Running Runs Above Average): Number of runs above or below average a player has been worth on the bases, based on stolen bases, caught stealing, extra bases taken, outs on the bases, and avoiding double plays.
Off (Offensive Runs Above Average): Number of runs above or below average a player has been worth offensively, combining Batting Runs and BsR.
Def (Defensive Runs Above Average): Number of runs above or below average a player has been worth on defense, combining Fielding Runs and the positional adjustment.
If you needed a refresher, now you understand how this became such a hot topic. The biggest argument was between the value of winning the Triple Crown (Cabrera) and having an insane 10.3 WAR (Trout). To put Trout’s season into context, his WAR was the highest by a player in the last 25 years not named Barry Bonds. To be fair, Cabrera won the Triple Crown for the first time in 45 years with a .330 batting average, 44 home runs and 139 RBIs. But if you dig just a little bit deeper, most signs point to Mike Trout being more valuable (and is why his WAR was so much higher).
But instead of digging through stats like wOBA and wRC+, WAR gives you an overall picture for what these stats measure. For example, a main reason for Cabrera’s significantly lower WAR was his poor base running (BsR) and defense (Def) – two areas that are typically overlooked (or flat-out ignored) in MVP discussions. As stated above, these stats are intended to measure the amount of runs a player creates with his base running and prevents with his defense. Trout was “worth” 21 more runs in both categories, and thus created and prevented approximately 42 runs altogether.
Baseball-Reference has shown that if you had to pick one number over the history of baseball to convert runs into wins, it would be 10. Using this estimation, Trout contributed about four wins (42/10=4.2) through his base running and defense alone. The difference between Trout’s WAR (10.3) and Cabrera’s (6.4) was 3.9, so Trout was worth about four more wins in 2012. Funny how that worked out, isn’t it?

Wrap-Up
In short, I hope you have a better understanding of what WAR exactly is and how to properly use it. The main takeaway should be that it is an approximation, not an exact measurement, of the number of wins a player has been worth (and that Trout was totally shafted in 2012). It’s a great way to compare players in terms of their caliber (such as a role player versus an All-Star), as well as determining a player’s overall value to their team. It’s not perfect by any means, but it is certainly useful and is a big part of my own MLB projection model that I use for betting baseball.
Speaking of which, my MLB model has had an incredible season so far and I track all the results here if you'd like to check it out. Because of its huge success, I recently launched a new service for my model’s baseball picks. My sports picks service has already earned subscribers 28 units in June alone, so a $10/unit bettor would have made $280 in just ten days! The small fee I ask quickly pays for itself, so what do you have to lose? If interested, click here to learn more about it and start investing your money in sports!