Earlier this month, I promised I would explain my MLB betting model. Well, today’s finally the day! I am not going to fully disclose everything, but I’ll detail enough about it for you to understand how it works. As I’ve said many times, I want to be as transparent as possible, and I feel you deserve to know how my picks are made.
This is my first full season with an MLB betting model, as well as the first time I used one for season win total picks, and I am beyond excited to see how it does. Last year, I used a similar model from July-September and was quite successful. That model went 254-258 for a return on investment of 8.42% (+123.08 units); not bad for something I whipped together mid-season.
As you can see, I won less than half of my bets but still made a good amount of money. That’s the beauty of betting on baseball. Since it is a moneyline sport (which means you typically bet who will win outright, not against the spread), you can still make money winning less than half your bets by betting on enough underdogs. This is one of three reasons why baseball is the best sport to bet, but for now just keep in mind this main advantage.
With that, let’s dive into my MLB betting model. First, this beast needed a name. I don’t eat much fast food, but I probably saw Taco Bell’s commercial of their new Triple Double Crunchwrap Supreme a thousand times during March Madness. Crunchwraps have always been my favorite thing to get at T-Bell, so it inspired me while working on my model to name it – The Clutchwrap Supreme. Catchy, I know. If you follow me Twitter or Reddit, you now know where this ridiculous name came from.
Preseason Preparation
Now that you know that almost useless piece of information, let’s get into the actual details. I first gathered statistics from the previous three seasons (mainly from FanGraphs) for each team’s hitting, defense and pitching performance. I did this to calculate my version of cluster luck, which Joe Peta in Trading Bases discusses throughout his book. This is very similar to Base Runs and Third-Order Wins for those familiar with the terms. I gathered the last three seasons because I wanted a better average to figure out how much to weight the statistics I felt were most important in creating and preventing runs.
For hitting, I mainly focused on on-base percentage (OBP), slugging percentage (SLG), and isolated power (ISO). I felt these contributed most to the amount of runs a team produced, and so I did a multiple regression to calculate how much each stat helped create the runs a team scored. Once I found these weights and plugged them into a formula, I projected each team’s runs they “should have” scored in 2016 based off the team’s hitting statistics. I then compared this to their actual runs scored. I refer to the difference as a team’s “cluster luck” runs.
Let’s look at 2016’s “luckiest” offensive team, the Angels, as an example:
| AVG | OBP | SLG | ISO | |
|---|---|---|---|---|
| League Average | 0.255 | 0.320 | 0.417 | 0.162 |
| Angels | 0.260 | 0.322 | 0.405 | .145 |
| Difference | +0.005 | +0.002 | -0.012 | -0.017 |
The Angels batting average and on-base percentage were right at league average for 2016, but were noticeably below average in slugging percentage and isolated power. Just from this, you could expect the Angels to reach base at an average clip, but many of those runners would be stranded due to a lack of extra base hits and home runs. Based on the formula I created from three seasons of team statistics, I would expect the Angels to score 683 runs from this production. They actually scored 717 runs, a whopping 34 run difference! With each ten runs in run differential equaling about one win (an accepted assumption in sabermetrics), that luck gave the Angels an additional three wins.
Now, many are going to be inclined to say that the Angels were actually unlucky based on their Pythagorean wins. The team scored 717 runs and gave up 727 runs in 2016, which should expect an 80-82 season based on baseball’s Pythagorean formula, not the 74-88 season they had. To be fair, this formula is typically very predictive for a team’s expected wins. However, it does not tell the whole story – hence the need for cluster luck.
Since the Angels scored 34 more runs than they should have, dropping their expected runs to 683, this takes away three wins. The Angels were also the luckiest team with cluster luck on the mound as well, having avoided 53 runs that their pitchers would be expected to give up based on their performances. This would give the Angels an expected runs allowed of 780. With almost 90 runs of cluster luck padding their run differential, the difference between their Pythagorean wins (80.0) and their expected wins without cluster luck (71.2) was the largest in the league last year.
Projecting Season Win Totals
I did this with every team to come up with expected 2016 wins for each, which I used as my starting point for 2017. Once I had this information, I factored in roster changes, aging, injuries, and 2017 player projections from FanGraphs. After entering this data, I projected each team’s runs scored and allowed based on its expected roster production. Then, I simply plugged in these numbers to the Pythagorean Theorem to estimate each team’s total wins for the 2017 season. This is what I came up with:
| AL West Team | Proj. Record | Win Percentage | AL Central | Proj. Record | Win Percentage | AL East | Proj. Record | Win Percentage |
|---|---|---|---|---|---|---|---|---|
| Astros | 86-76 | .531 | Indians | 89-73 | .552 | Red Sox | 92-70 | .568 |
| Mariners | 83-79 | .512 | Tigers | 76-86 | .469 | Blue Jays | 85-77 | .525 |
| Rangers | 80-82 | .494 | Royals | 71-91 | .440 | Orioles | 84-78 | .519 |
| Angels | 77-85 | .475 | Twins | 70-92 | .432 | Rays | 82-80 | .506 |
| Athletics | 72-90 | .444 | White Sox | 66-96 | .407 | Yankees | 79-83 | .488 |
| NL West Team | Proj. Record | Win Percentage | NL Central Team | Proj. Record | Win Percentage | NL East | Proj. Record | Win Percentage |
|---|---|---|---|---|---|---|---|---|
| Dodgers | 93-69 | .572 | Cubs | 95-67 | .586 | Nationals | 90-72 | .556 |
| Rockies | 85-77 | .525 | Cardinals | 85-77 | .525 | Mets | 81-81 | .500 |
| Giants | 83-79 | .512 | Pirates | 77-85 | .477 | Marlins | 77-85 | .475 |
| Diamondbacks | 75-87 | .463 | Brewers | 72-90 | .444 | Phillies | 71-91 | .439 |
| Padres | 66-96 | .407 | Reds | 69-93 | .427 | Braves | 68-94 | .420 |
Daily Projections
My model now gave me the expected win percentage for each team over 162 games, however, I need my model to make picks on a daily basis. Since hitters, fielders and pitchers change daily, I need to account for who is on the field each game. To do this, I made my model adjust for the daily line-up and the starting pitcher for each team. Instead of assuming 15-20 hitters and 5-10 starting pitchers are going to contribute to 162 games, it now predicts how many games a team should win during the season if they fielded the exact same line-up and starting pitcher each day*. My model also updates daily with players’ actual production and projections for the rest of the season from FanGraphs. As the season progresses, actual production will gradually be weighted more and more.
*Note that I do not mention anything about bullpens. Although my model includes projections and actual performance for individual relievers, it is near impossible to predict who will pitch in a specific game. Due to this, I use collective “Bullpen” statistics as part of each team’s overall projection each day.
Let’s use the Seattle Mariners from last night as an example.
| Match-Up | Line-Up Exp. Win% | ML Odds | Implied Prob. | Projected Prob. | Edge/Value |
|---|---|---|---|---|---|
| Mariners | 54.6% | -142 | 58.7% | 60.4% | +1.7% |
| Athletics | 39.9% | 132 | 43.1% | 39.6% | -3.5% |
Seattle had James Paxton starting on the mound at Oakland. Overall, my model projected the Mariners to win 51% of their games (83 wins). However, it projects the Mariners to win 54.6% of their 162 games if they put out the same line-up they had last night for every game. This is mainly because James Paxton started and is Seattle’s best pitcher. In other words: if Paxton theoretically started all 162 games this season, and the Mariners put out the same batting line-up each day, my model expects the Mariners to win 54.6% of the time.
My model did the same thing with Oakland and projected their line-up from last night to win just 39.9% of their games. After some “basic” probability calculations, my model projected the Mariners to have a 60.4% chance to beat the Athletics. The Mariners were listed as (-142) favorites on the moneyline, which means you needed to bet $144 to win $100 if you bet on Seattle (or $14.40 to win $10, $7.20 to win $5, etc.). This implies a 58.7% probability for the Mariners to win, so my model gives them a small 1.7% edge* to win the game.
*I often refer to the percent edge as value when I send out picks.
Once I know if a team has a projected edge, I know how much to bet each pick. For the first three weeks of the season, I bet every edge with the following weights:
| % Edge/Value | 0-3% | 3-5% | 5-9% | 9-11% | 11-13% | 13-15% | 15%+ |
|---|---|---|---|---|---|---|---|
| Bet Size | 1 unit | 2 units | 3 units | 3.5 units | 4 units | 4.5 units | 5 units |
Since the Mariners have just 1.7% of value, I would only bet one unit. Had the edge been 3.7%, I would bet two units. Typically, edges won’t exceed five percent, but when they do, I want to hit them hard with three or more units as this would be a huge perceived edge (i.e. positive expected value, or +EV).
MLB Betting Model 2017 Results
To help visualize this more, let’s look at my picks’ results from the other day:
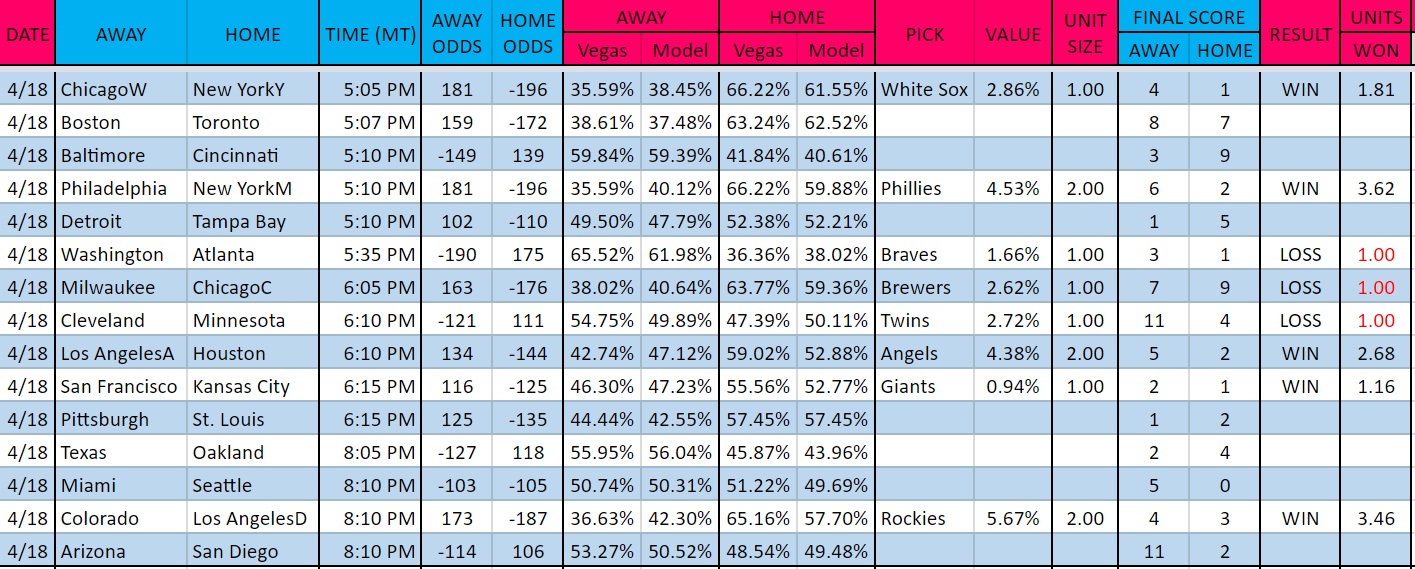
This was a big winning day (+9.73 units!), mainly because my model’s picks with the largest perceived edges all won. This won’t always happen, but it worked out this time. As you can see, my model calculates the implied probability* (Vegas columns) for each team’s odds and compares it to the projected probability (Model columns) for each team to win. As noted above, the difference between these two percentages is the perceived edge, or the amount of value for each pick. Based off my unit allocation table from earlier, I made the bets listed in the above image.
*Implied probability is fairly easy to calculate. Click here for a calculator and the formulas to do it yourself.
A $10/bet player would have won $97.30 with these picks, which is always a great day. After almost three weeks, my model has gone 84-83 to win 22.04 units with a 13.24% return on investment (units won/units risked). This is very promising, and it gets even better. I did testing to find the optimal value for picks, and found that picks with at least 3% of value have been the most profitable having won 27.10 units (71.6% ROI) thus far. I definitely don’t expect to maintain that phenomenal ROI for a whole season, but I couldn’t be happier with the results as higher perceived edges are performing better than lower ones. Simply put, this means the model is working.
I hope you now have a better understanding of my MLB betting model and how my picks are made. I tried to keep it as simple as possible, but feel free to ask me a question about it (or betting in general). And if you’d like access to all my MLB picks (along with the others sports I cover), click here!
Thanks for reading and good luck!