Dear (sports) investors,
Below is my report for Fast Break Bets’ first quarter performance during the MLB season. It includes overall results for my MLB model (the Clutchwrap Supreme), our most and least profitable teams, as well as the first quarter's most over- and under-valued teams. I’ll be sending out a report just like this for each quarter to keep you up to date on the model’s performance and the league as a whole.
Model Results
As you are probably aware, my MLB model and betting picks performed extremely well for the first seven weeks of the season. We were well ahead of the market for the first month thanks to accurate player projections and identifying undervalued teams in April. Sportsbooks and the general public were too focused on last year’s numbers, which helped us profit in a big way.
After hitting a new high of 45.5 units won on May 3, our total winnings bounced between 30 to 40 units for the next week. Every sports bettor should expect a cold streak from time to time, but this seemed a bit prolonged. So, I did some extra research and tested out a few adjustments. On May 10, I introduced those adjustments into my projections, and as you will see from the chart below, quickly took us to new highs shortly after.
As of May 19, we are currently at 52.33 units won - just below our season high after a couple losing days. However, this number (and the running total I use for units won with my results updates) is without any unit size rebalancing. What do I mean by this? If you do not adjust your bet size to reflect your current bankroll, you would be betting less than our bankroll management strategy suggests. I’ll use an example to better show this.
Let’s say we started with a bankroll of $1,000 at the start of the season. I advised using 1% per unit bet, so a 1 unit bet is $10, 2 units is $20, etc. After one week of betting my model on April 9, we were up 9.50 units; which means we had theoretically won $95 and increased our bankroll to $1,095. If we re-balanced our bet sizes, one unit would now be $10.95 (instead of $10). This is a common strategy to use, but the timing depends on your own goals, strategy, and confidence level. I think doing this weekly is best for my system, but you can be more conservative by doing it once every two weeks or once a month. Daily is definitely too aggressive though, as variance can hurt you big time.
With that said, the chart below shows our bankroll growth during the first quarter of the season. The gray line is units won without any bet size adjustments (the number I show results with daily). The blue line is actual bankroll growth if you had re-balanced your bet sizes weekly (what I do and recommend).
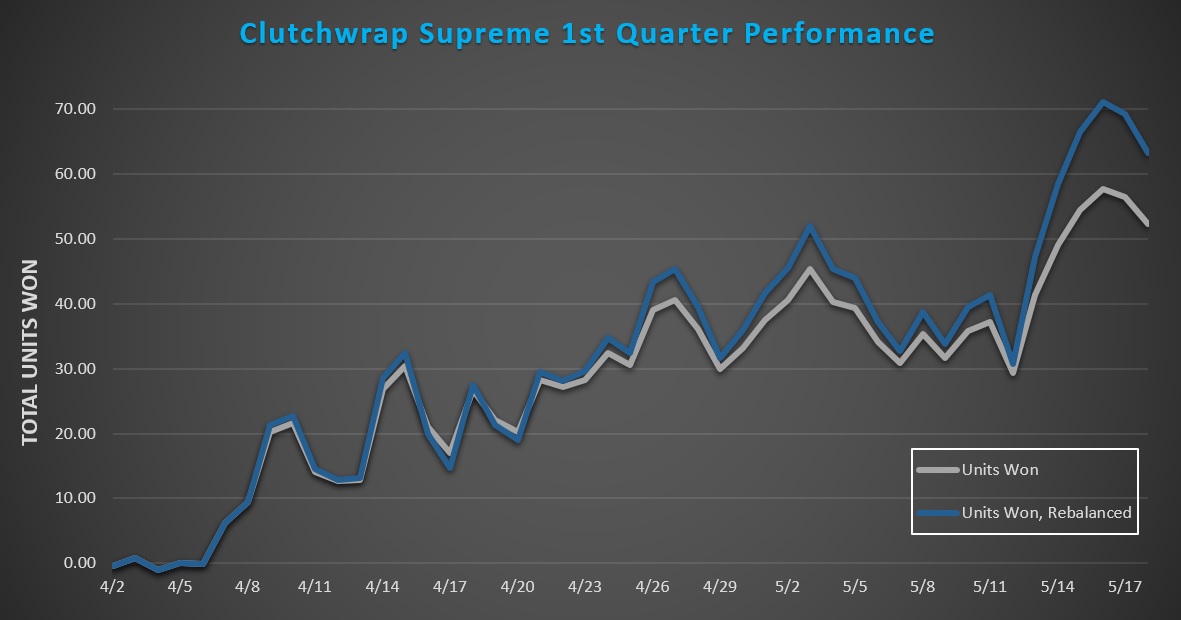
Weekly adjustments to your bet sizes clearly compounds your profits with my model as this method currently sits at 63.22 units won (versus 52.33 units). Using the same $1,000 starting bankroll, a $10/unit bet on all picks would currently put your balance at $1,632. In other words, you have increased your initial investment by 63% in seven weeks. Had you not re-balanced and chosen to pocket the profits instead of reinvesting them, you would still be a big winner with a $1,523 balance (52% return).
Whether you have tailed my picks since Opening Day or just found me, there’s plenty of profits left to be made. We have 75% of the season to go, and my model is showing no signs of slowing down. I’ll continue to find value in the market and offer the best MLB picks you can find.
Most and Least Profitable Teams
As good as the model’s performance has been, it hasn’t been perfect. It’s done very well betting on certain teams, and not so well on others. Here’s a quick breakdown of the model’s top and bottom five teams based on units won/lost:
| Most Profitable Teams | Units Won | Least Profitable Teams | Units Lost |
|---|---|---|---|
| Diamondbacks | 23.51 | Cubs | -13.31 |
| Giants | 15.03 | Marlins | -11.56 |
| Royals | 9.92 | Cardinals | -6.36 |
| Tigers | 9.06 | Padres | -6.28 |
| Rockies | 8.39 | Phillies | -4.65 |
I am not surprised by the top of either side of the table. The Diamondbacks have outplayed many “experts” predictions, especially early in the season. Arizona has been the model’s most profitable team since the first week, and they have one of the best offenses in baseball once again. The resurgence of Zack Grienke has also been a huge boost for one of the league’s worst rotations from last season.
As for the Cubs, they’ve done the opposite and have played below expectations up to this point. Starting pitching has been a big concern, but it’s starting to come together with recent strong outings from Lester, Lackey and Hendricks. I also wrote last week about the Cubs being one of the unluckiest teams with runners in scoring position. That is starting to turn around after scoring 25 runs in three games against the Reds. Bullpen depth is starting to be a concern though, so the starting pitching will have to start eating more innings very soon.
Like the Diamondbacks, the Rockies have also outperformed most expectations and are currently in first place in the National League West division. I projected this team to be around .500 before the season started, but instead they are currently 26-16. We’ll most likely see a bit of regression, as their run differential suggests they should be 22-20 according to baseball’s Pythagorean Theorem. They are also a perfect 9-0 in one run ball games. Part of that is due to outstanding pitching from their relievers as the Rockies have the best rated NL bullpen according to my model. However, history tells us this should start to even out towards 50% - unless we have another outlier like the 2016 Texas Rangers (36-11 in one-run games last year).
Over-Valued and Under-Valued Teams
Just like in the stock market, determining under- and over-valued teams when betting on sports will make you a big profit in the long run. In baseball, this is actually quite simple to do since it is a moneyline sport. All we have to do is find each team’s average odds, convert it to its implied win probability, and compare it to the team’s actual win percentage.
For example, the Astros have (shockingly) been the most under-valued team so far. Their average moneyline odds have been -133, which implies a 57.1% win probability. Their actual win percentage as of May 19, however, is 70.7% with a 29-12 record. That’s a difference of 13.7%. If you had simply bet one unit on the Astros to win every game so far, you would have a very nice profit of 13 units. I wouldn’t expect this to continue though, as the Astros recent hot streak has caused a big adjustment in their pricing recently.
With that said, here are the league’s top five under-valued teams:
| Team | Avg. ML Odds | Implied Prob. | Actual Win % | % Difference |
|---|---|---|---|---|
| Astros | -133 | 57.1% | 70.7% | 13.7% |
| Rockies | +107 | 48.2% | 61.9% | 13.7% |
| Brewers | +115 | 46.4% | 57.1% | 10.7% |
| Orioles | +101 | 49.8% | 59.0% | 9.1% |
| Yankees | -119 | 54.3% | 63.2% | 8.9% |
I mentioned how we shouldn’t expect the Astros to be under-valued much longer, but what about the other teams? In the last section, I went over my expectation for the Rockies. Their win percentage should start to drop over time, so they won’t be as under-valued, but 13% is still a big difference.
The Brewers and Orioles have had surprising starts as well and are not too far behind the Rockies and Astros regarding value. However, these teams rank second and third, respectively, in my cluster luck calculations. Basically, the sequencing (i.e. clustering) of their hits have resulted in much more runs than average; and the hits they’ve given up have produced much less. As cluster luck implies, this is more attributed to luck than skill.
The most shocking team above must be the Yankees. They are regularly one of the most over-valued teams year after year due to their popularity, yet they have actually been UNDER-valued. I don’t think anyone anticipated them to be this good – hell, I didn’t think they’d be good at all. They’ve proven a lot of people wrong though, and their metrics suggest we should expect them to continue playing at a high level. They are the Yankees though, so I don’t imagine their value will stick around.
Now, onto the league’s most over-valued teams:
| Team | Avg. ML Odds | Implied Prob. | Actual Win % | % Difference |
|---|---|---|---|---|
| Marlins | +105 | 48.7% | 35.0% | -13.7% |
| Mets | -119 | 54.3% | 41.0% | -13.3% |
| Giants | -104 | 50.9% | 40.5% | -10.4% |
| Padres | +129 | 43.6% | 34.9% | -8.7% |
| Indians | -150 | 59.9% | 51.3% | -8.6% |
I touched on the Marlins a bit to explain their position at the top of this list. Miami has been a favorite of sharp bettors, which has caused their price to rise almost daily. They seemed to be a good team to back early on, and even I predicted they could be a surprise team in the NL East. However, they have been terrible as of late. The Marlins have lost five straight and 9 of their last 10 games, and have been outscored 72-30 in those 10 games. My model continues to like the Marlins in its projections, but I won’t be playing those any time soon.
The Mets and Giants are mainly on this list because they had playoff-contending expectations from many people. I actually predicted both to go under their preseason win total, and both bets are looking very good right now. The Mets’ glorified rotation is riddled with injuries, and losing Madison Bumgarner was a big blow to an otherwise subpar rotation for the Giants.
The final team on this list, the Indians, isn’t all that surprising. Last season’s American League champions have been sluggish out of the gate starting 21-19, and seem to be taking the same attitude as the Cavaliers about the regular season. The AL Central is terrible, so they know they can just coast to the playoffs. Francisco Lindor indirectly admitted this the other day after a loss by saying, “we just need the playoffs to start.” Unless LeBron is going to play for them in October, I don’t know if they can just flip a switch and dominate. Baseball is a long season though and there are still 120 games to be played, so they have plenty of time to play to their potential. In either case, I wouldn’t be strongly backing the Indians in the near future.
Summary
As you can see, Fast Break Bets had an incredible first quarter for the MLB season. My projection model is stronger than it was Opening Day and continues to find value on a daily basis. We still have 75% of the season to go, so if you haven’t already been tailing, you still have plenty of profit to make by joining today.
To do so, be sure to subscribe via email and follow me on Twitter. Since my model needs each team’s starting line-up, I send out a quick preview each morning and then tweet my model’s picks later in the day.
I’ll write my next quarterly report around June 30, but I will still continue to publish new articles weekly to keep you up to date with the sports betting world. As always, feel free to email me or send me a message on Twitter with any questions you have!
Best of luck,
Stephen
2 thoughts on “MLB Quarterly Report”
Would it be possible to list the books you use? I notice when I get on my computer after your tweet that the lines I’m seeing are worse than yours. Thanks again for all you do. Been fun learning this myself and hearing you speak it out loud.
Hey Jon! Sorry you haven’t always been able to get the same lines – I use Heritage, 5Dimes and BetOnline. I’m actually working on a new update to my model that will allow me to get picks out quicker, and give people more time to bet before the lines move. Thanks for reading and I’m glad the site has been helpful!